
2026-04-28
Racing insights with Airflow 3 and dbt
Exploring F1 race data with Airflow 3, dbt and Clickhouse

Racing insights with Airflow 3 and dbt
Apache Airflow and dbt have been the bread and butter of data engineering for some time now. Airflow is the orchestration layer that allows teams to schedule and manage complex workflows and dbt is the transformation layer that allows teams to build and maintain their data models. dbt enables teams to write modular SQL code, test and document data models and manage dependencies between them. This can then be run on a schedule using Airflow.
Below is a brief history of my experience with Airflow and dbt, feel free to skip this section to get to the juicy part.
I first used Airflow and dbt back in 2018 when I was working for Voicemod. We were running Airflow on an EC2 instance with dbt running using bash operators. Our warehouse back then was Amazon Redshift, which at the time had coupled storage and compute, so we had to be careful with our queries, instance choices, vacuuming to clear up space and analyzing to update statistics for the query planner. Being one of the first data engineers at the company, I remember being quite proud of putting the pieces together and getting the first DAGs running.
Over the course of my career, I worked with Airflow and dbt in various companies with different warehouses, technology stacks and team sizes. I have also used Airflow with other transformation tools like Apache Spark, Apache Beam and custom Python applications across Local, Celery and Kubernetes executors. However, much like anything in software engineering, regardless of the stack you use, the principles of data engineering remain the same.
A tool like Airflow gives data engineering teams the ability to create, automate and monitor complex data pipelines. It can run transformations in a variety of ways(containers, python, sql, bash). Its rich collection of operators, sensors and hooks integrate with a vast number of services and platforms, both open-source and vendored. dbt is just one of the ways to run transformations, but it is a very popular one due to its simplicity, modularity and focus on SQL. Airflow itself has evolved over the years, with new features and improvements being added regularly. The community is quite active and there are many resources available for learning, troubleshooting and sharing personal experiences.
I recently had the opportunity to create and implement the data strategy for my organisation which gave me yet another chance to set up a data engineering stack using Airflow and dbt from scratch. With the new features and improvements that have been added to both tools over the past years, I decided to play around with it, setup the stack, the repository structure, the DAGs and the dbt models to make the most of these new features. I will be adding to this post as I change or add things, including best practices and reusable custom operators and macros that I have found useful.
The repository for this project can be found here.
Fun fact: For those wondering why the name of the repository is Artemis and drawing comparison between the Greek Goddess and the data stack here, there is no particular reason. I was just tired of boring names like flink-datastream or airflow-dbt.
Contents
- Choosing the components
- Setting up the stack
- Data Source
- Data modeling
- Airflow DAGs and dbt models
- Incremental Strategy
- Analysis and Visualisation
- Operational Observability
- Asset based scheduling
- Conclusion
Choosing the components
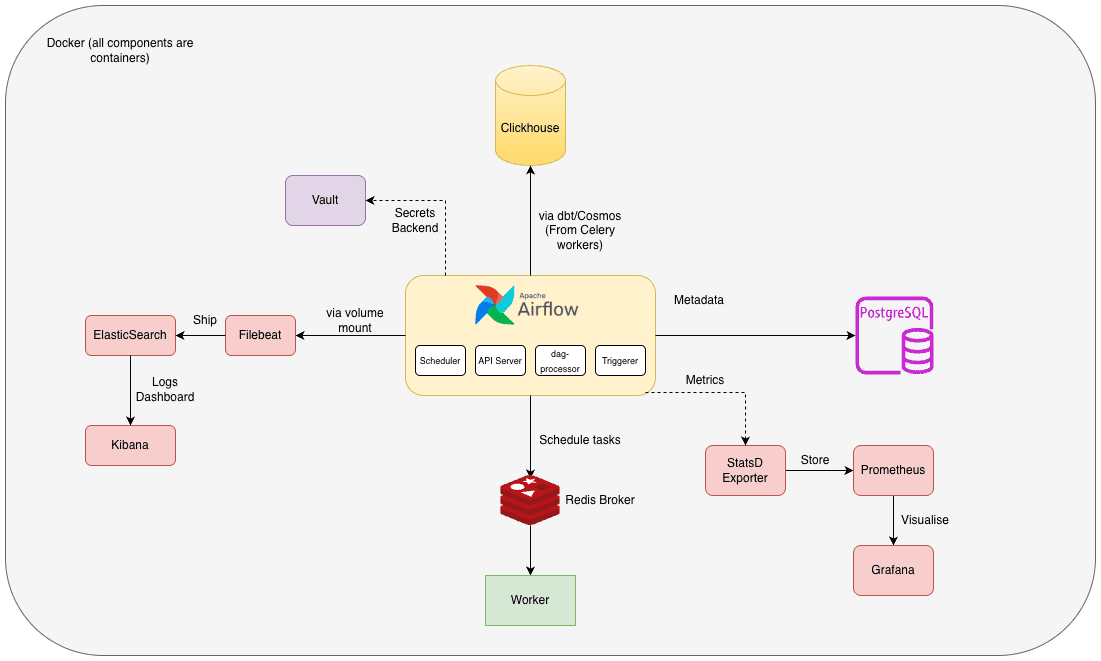
I chose to use Airflow 3 + Celery executor for orchestration as it is what AWS MWAA (Managed Airflow) uses behind the scenes for their offering. I'm evaluating it for my organisation as part of our data strategy and wanted to get a better understanding. The only difference would be that AWS Managed Airflow uses SQS as the broker for Celery and syncs dags, requirements, plugins and bootstrap scripts from S3, and the metadatabase hosted on the AWS service VPC is Aurora Postgres. For this local setup, I'm using Redis as the broker and Postgres as the metadatabase, running on Docker.
For the data warehouse, I chose to use Clickhouse. I could've also gone with Postgres for simplicity or DuckDB but decided to emulate a more production-like environment with a columnar data warehouse. It integrates well with Airflow and dbt too. For the transformation layer, I'm using dbt with the Clickhouse adapter. Choosing a transformation tool depends on factors like team's skills and preferences and the underlying warehouse or query engine. My team is proficient in SQL and we use Snowflake as our data warehouse, dbt is a great choice for us.
Since I'm emulating a production-like environment, I also added services like Vault for secrets management (Airflow can use this as a secrets backend, similar to AWS Secrets Manager for AWS Managed Airflow), ElasticSearch (Filebeat, Kibana) for logging and Prometheus(with StatsD exporter for Airflow metrics, Node exporter for System metrics) + Grafana for monitoring and visualisation. I've extended the default docker-compose.yaml provided by the Apache Airflow project to include these additional services. It also has a profile with the Flower service for monitoring the Celery workers.
Grafana supports ElasticSearch as a data source as well for visualising and querying logs. However, I went with Kibana in this case because it has native out-of-the-box support for ElasticSearch. In a production setup, I would have set it up on Grafana to have a unified dashboard for Airflow metrics and logs.
Architecture Overview
I'll visualise the architecture here so it's easier to understand how they interact with each other.
Setting up the stack
To set up the stack, you would need to have the following installed on your machine:
DockerandDocker ComposePython 3.12uvfor managing Python dependencies
I developed this on a machine running Ubuntu(x86_64) but it should work on any platform with minor adjustments, especially for the Makefile commands.
To launch the stack, run:
1make launch-stack
2
Optionally, if you make changes that need to be baked into the Airflow image, you can run:
1make launch-stack BUILD=1
2
This will bring up the following services:
- Airflow apiserver (Webserver), scheduler, triggerer, dag processor, worker and flower (Celery UI)
- Postgres (Airflow metadata database)
- Redis (Celery broker)
- Clickhouse (Data warehouse)
- Metrics stack (Prometheus, Grafana, Node exporter, StatsD exporter)
- Elastic Stack (Filebeat, Kibana and ElasticSearch) for logging
- Vault (Secrets management)
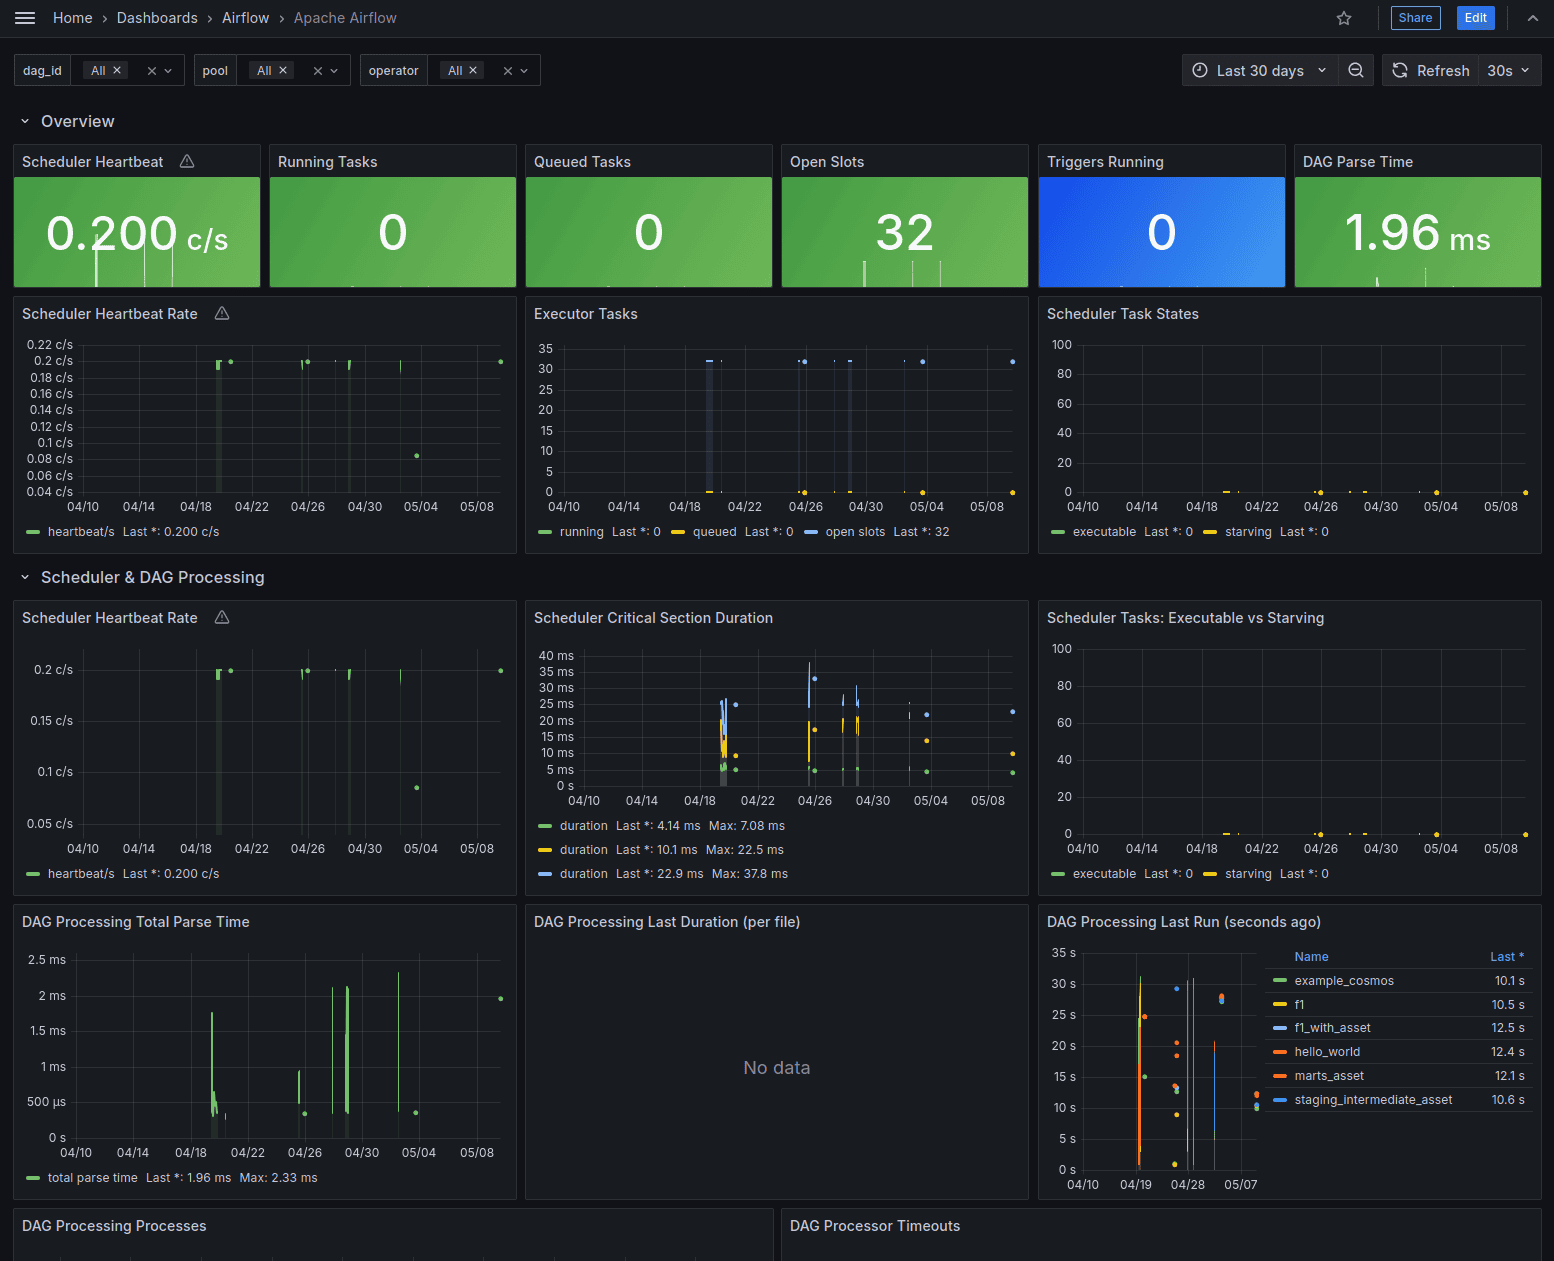
For the metrics, navigate to port 3000 on your localhost to access Grafana. You'll find a dashboard for Airflow under Dashboards > Airflow. It contains various metrics about the DAG runs, task runs, scheduler performance and more.
For connections and variables, I've set the airflow secrets backend to Vault.
1AIRFLOW__SECRETS__BACKEND: airflow.providers.hashicorp.secrets.vault.VaultBackend
2AIRFLOW__SECRETS__BACKEND_KWARGS: "{\"connections_path\": \"connections\", \"variables_path\": \"variables\", \"config_path\": null, \"url\": \"http://vault:8200\", \"token\": \"airflow\", \"mount_point\": \"secret\"}"
3
Data Source
I've been wanting to play around with F1 data for a while now so I thought I'd try it out in this project. I'm using the REST API from Open-F1. It's a free and open source API so please respect the rate limits. The API is quite simple to use and provides a lot of data about different F1 meetings and sessions.
Open-F1 is not affiliated with Formula 1 and is an unofficial API.
For this project, I was only interested to analyse the Japanese Grand Prix at Suzuka on March 29, 2026. It was an incredible race with Kimi Antonelli taking the pole for Mercedes.
I believe there were some gaps in the data from the API so take the analysis with a grain of salt.
The Open F1 API has various endpoints for different types of data. I used the following endpoints:
meetings: A meeting is a collection of sessions that take place over the race weekend. It usually consists of practice sessions, qualifying and the race.sessions: A session is a specific event in the race weekend.drivers: Information about the drivers.laps: Information about laps by various drivers in different sessions.stints: A stint is a continuous period of time that a driver spends on the track during a session.
You can add more endpoints and enrich the data as you like.
Data modeling
The dbt project follows a fairly standard layered approach: raw, staging, intermediate and marts. The goals is to have clear separation of concerns and dependencies between the models.
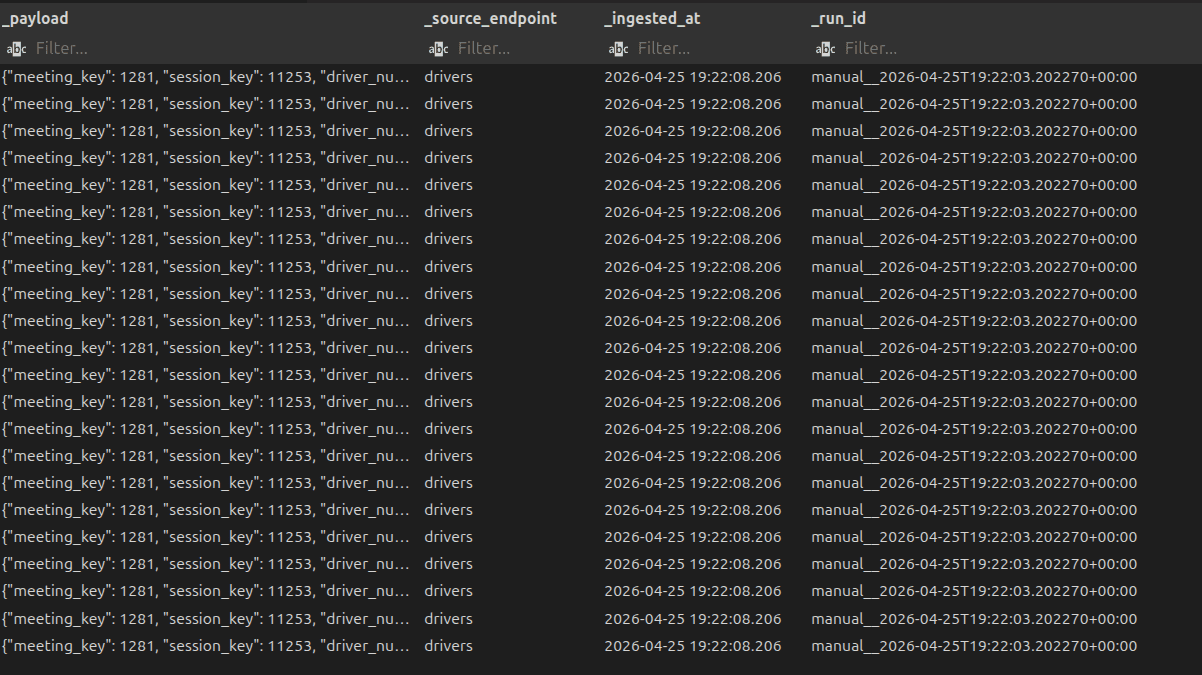
The raw layer stores the API responses in their raw JSON format with some extra metadata. In a production setup, I would usually land this data first in object storage like S3 as immmutable files but since I'm evaluating a replacement for MinIO, I decided to keep it simple for now.
The staging layer is where the raw data is transformed into a more structured format. These models extract fields from the raw JSON payload, cast values into the correct data types and perform basic transformations. The intermediate layer contains business logic and joins between the different staging models that can be reused across different marts. It joins laps, stints, drivers and sessions data to create a richer lap level or driver session level view. This is where most of the transformations and calculations happen.
The mart layer is dashboard-facing. It answers specific analytical questions rather than expose the generic transformed data. Examples include, race pace by driver, tyre compound performance, stint degradation, position gain/loss etc. Keeping these models separate makes it easier to change the dashboard without destabilising the resuable layers underneath.
One principle I try to follow is to have a clear grain for each model. A lap-level model would have one row per driver per lap per session. A stint model would have one row per driver per stint per session. Being explicit with the grain avoids a lot of subtle bugs later, especially when aggregating lap, stint and pit data together.
Airflow DAGs and dbt models
The Airflow DAGs are mounted from the artemis/dags directory. The main DAG is the f1 dag in artemis/dags/f1.py.
It contains the following tasks:
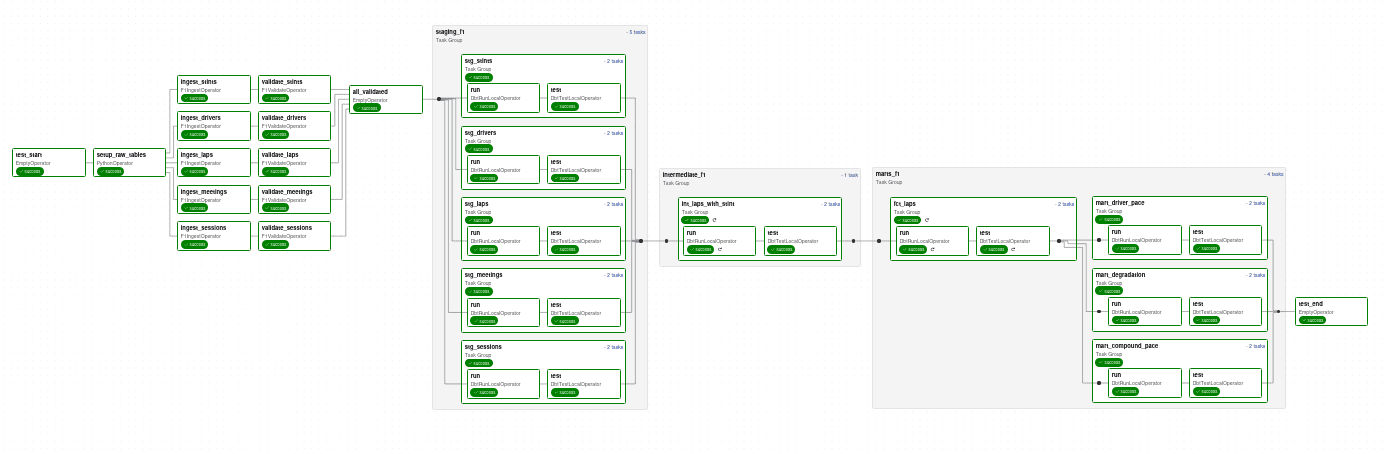
setup_raw_tables: Custom operator that sets up the raw tables in Clickhouse. This is a one-time task that creates the necessary tables for storing the raw data from the API. Typically, data engineering teams write raw data into a data lake or raw layer on object storage like S3 or GCS. I haven't added an object storage layer in this stack yet so I'm writing the raw data directly into Clickhouse. Data is stored in its raw JSON format with some extra metadata.
MinIO used to be my go-to choice for object storage in local dev setups but the repo is now archived/no longer maintained, and community edition is source-only.
-
validate_task: Custom operator that validates the data in the raw tables. The expected schemas are defined usingPydanticmodels underartemis/dags/common/components/f1_validate.py. It streams blocks from the raw tables and validates them using a batched approach. If there are any validation errors and they exceed the threshold, the task fails. -
staging: This task uses the Astronomer Cosmos package to run dbt models. It runs the staging models underdbt/f1/models/staging. It runs as aTaskGroupand runs the model and the tests in the dbt project. The dbt profiles are set up to use theClickhouseadapter and the connection details are pulled from Airflow connections using the Vault secrets backend. Staging models simply extract the relevant fields from the raw JSON data and perform basic transformations. -
intermediateandmart: These tasks are alsoTaskGroups that run the intermediate and mart models. The intermediate models join the laps and stints data to create a more comprehensive view of the drivers' performance in each session. The mart models create aggregated tables for different metrics relevant to the race analysis.
There are a lot of optimisations that can be done in the DAG and the dbt models, especially around incremental loading and testing. The setup and validate tasks could also be added to a TaskGroup for better organization.
Incremental Strategy
In this project, the pipeline is intentionally simple and the dataset is small enough that full refreshes are acceptable. However, in a production setup with larger datasets that receive regular updates, its important to consider an incremental strategy to avoid long runtimes and unnecessary resource consumption (cost, compute, memory). So I thought how I would implement an incremental strategy if I were to run this in production.
The first thing I would do is separate endpoints by update behaviour. Small dimension endpoints like meetings, sessions and drivers can be usually refreshed in full. They don't change often and the volume is relatively small. Larger event endpoints like laps, stints, position and pit are better candidates for incremental processing. With the current F1 data source, races are usually far apart so you could think of it like micro-batch updates during race weekends.
For raw ingestion, I would make each API pull idempotent. Each raw row will include endpoint, query parameters, ingestion timestamps and the Airflow run_id with a payload hash. This makes it possible to detect duplicates, reason about what was fetched and safely replay a failed run. For ClickHouse, this would use a ReplacingMergeTree table engine or even appending to the raw data and deduplication in the staging layer.
For the dbt models, I would set up the incremental strategy based on the grains. A lap-level model would use a key such as session_key, driver_number and lap_number to identify unique rows. A stint-level model would use session_key, driver_number and stint_number. For derived marts, this would be rebuilt by session_key or meeting_key depending on the metric. This way, when new data comes in for a specific session or meeting, only the relevant partitions of the data would be updated.
Analysis and Visualisation
I created the dashboard for this project using Grafana connected to Clickhouse. Once I came up with the metrics I wanted to track, I input this to Claude to generate the dashboard JSON for Grafana. It took a couple of iterations but the end result was quite good and saved me a lot of time. For tasks like this, I find using GenAI to be a huge time saver and allows me to focus on the more interesting parts of the project.

As mentioned before, the data from the API had some gaps so the analysis and visualisation might not be entirely accurate.
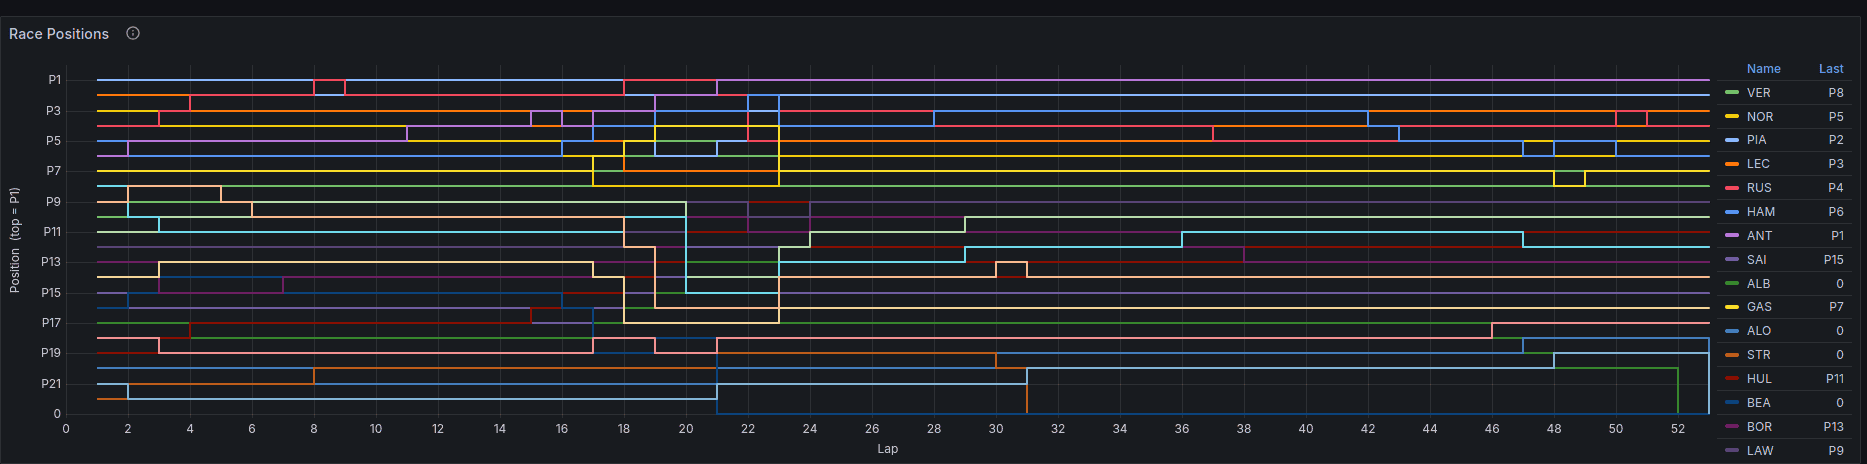
But overall, it does provide some interesting insights:
- Kimi Antonelli with a pole position.
- Kimi gets to and holds the lead in the 22nd lap.
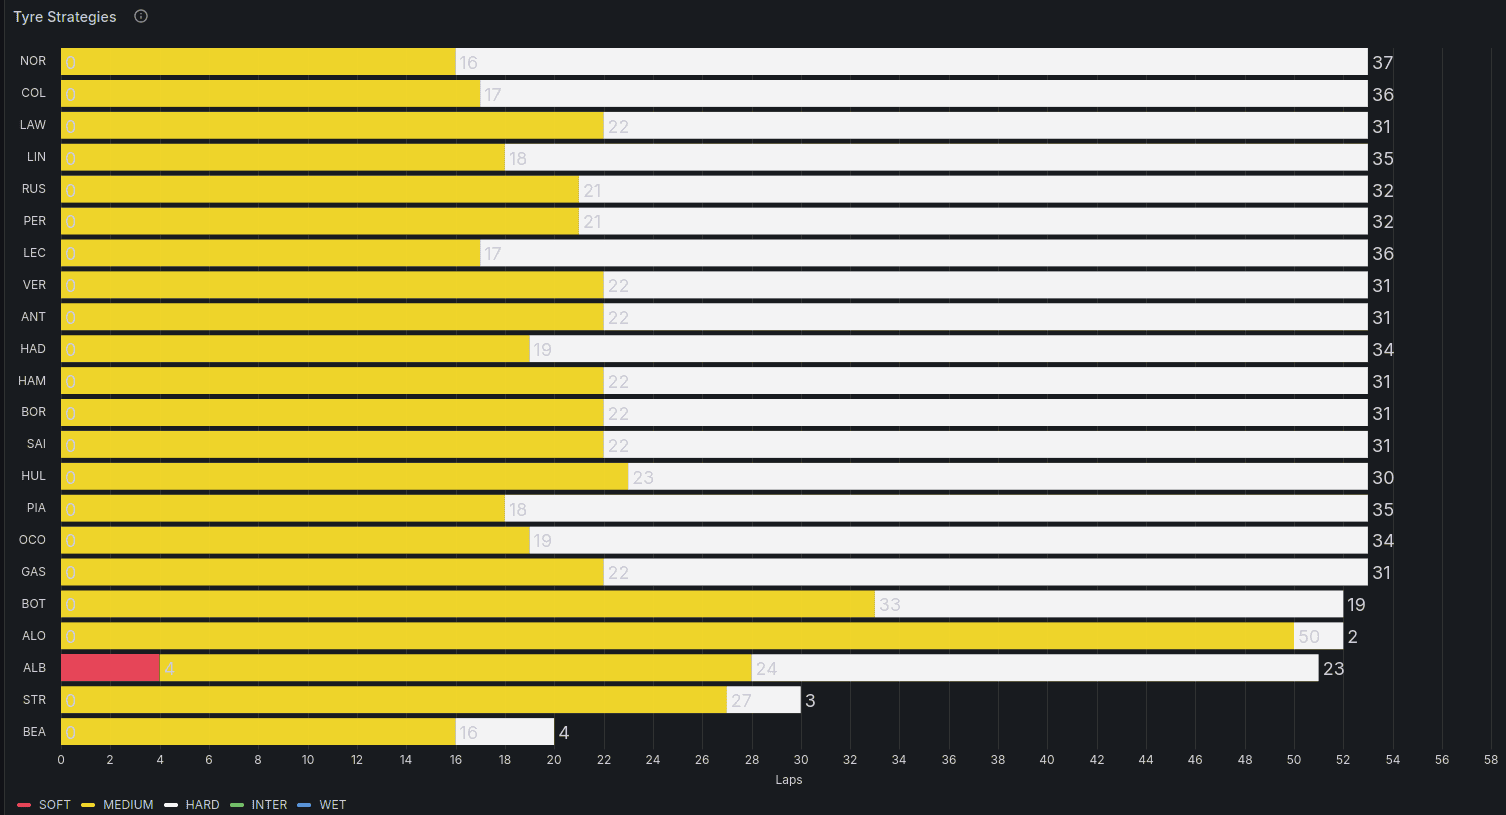
- Lando Norris is one of the first to switch to hard tyres in the 17th lap.
- George Russell switches to hard tyres in the 21st lap, one lap before Kimi.
- Alex Albon from Williams Racing had a lot of issues with the car leading to lots of pit stops.
- Nico Hülkenberg dropped to P19 but managed to gain 8 places up to finish in P11.

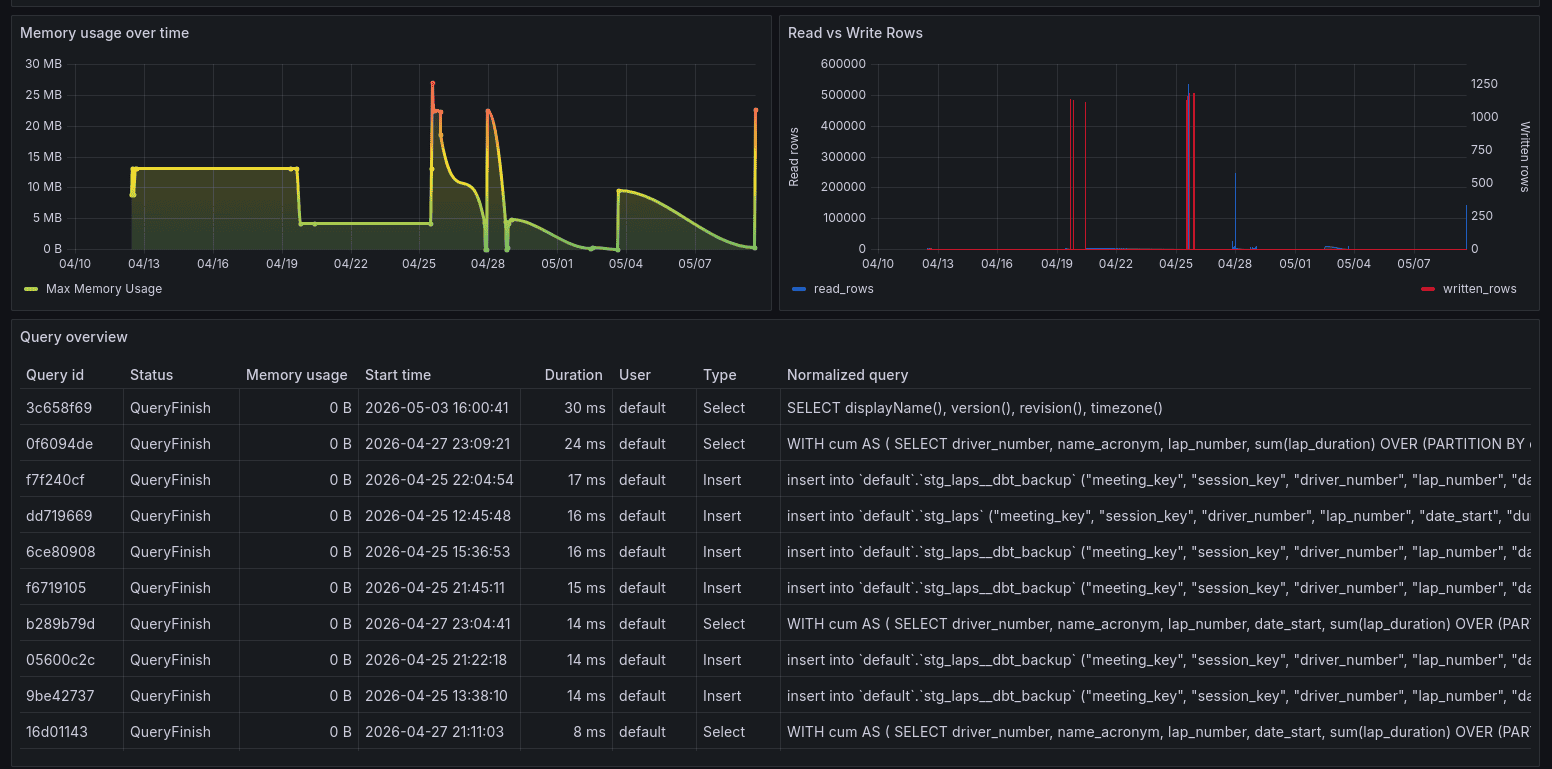
Operational Observability
As mentioned before, I added Prometheus, Grafana, StatsD exporter, Filebeat and ElasticSearch because I wanted the local stack to feel closer to a real production setup. It helps understand how the system behaves when something is slow, broken or noisy.
For Airflow, the most useful metrics are around scheduler health, task latency, resource starvation/utilisation and executor capacity. Metrics like scheduler heartbeat, DAG parse time, task duration, task queue time, pool and slots status, task failure rate can help answer questions like whether the pipeline is slow because the source API is slow, the scheduler is overloaded or there are not enough workers to run the tasks. For example, if the task queue time is high and the pool and slots are full, it indicates that there are not enough workers to run the tasks. If the scheduler heartbeat is delayed and DAG parse time is high, it indicates that the scheduler is overloaded or even down.
For dbt, model runtime is a useful metric to track. Since I'm using Cosmos to run the dbt models, I can use the Airflow UI/metrics to track the runtime of each of the dbt models, tests and the entire TaskGroup. A dbt run that becomes 10x slower is a good operational signal to have. Over time, I want to also track model duration, test failures, row counts and freshness metrics in a more systematic way. This is something I am currently building for my organisation and I will share it in a future post once it's ready.
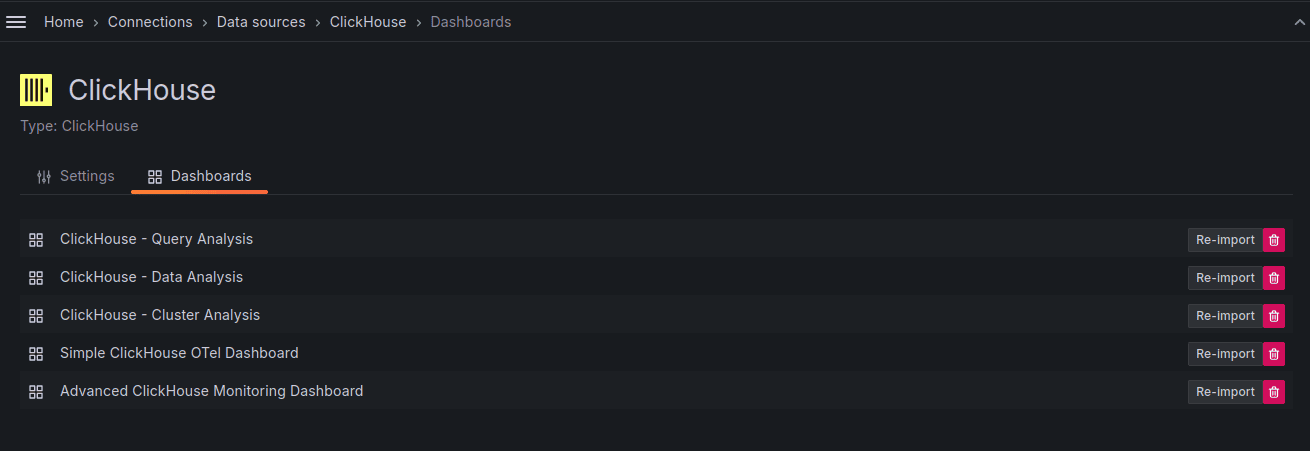
For ClickHouse, you can enable cluster metrics while adding the Grafana data source. Go to Menu > Administration > Plugins and data > Plugins and add the ClickHouse plugin from Grafana Labs. Next, go to Menu > Data sources and add a new data source for Clickhouse. In the Dashboard tab for that data source, you can import the various ClickHouse dashboards from Grafana Labs.
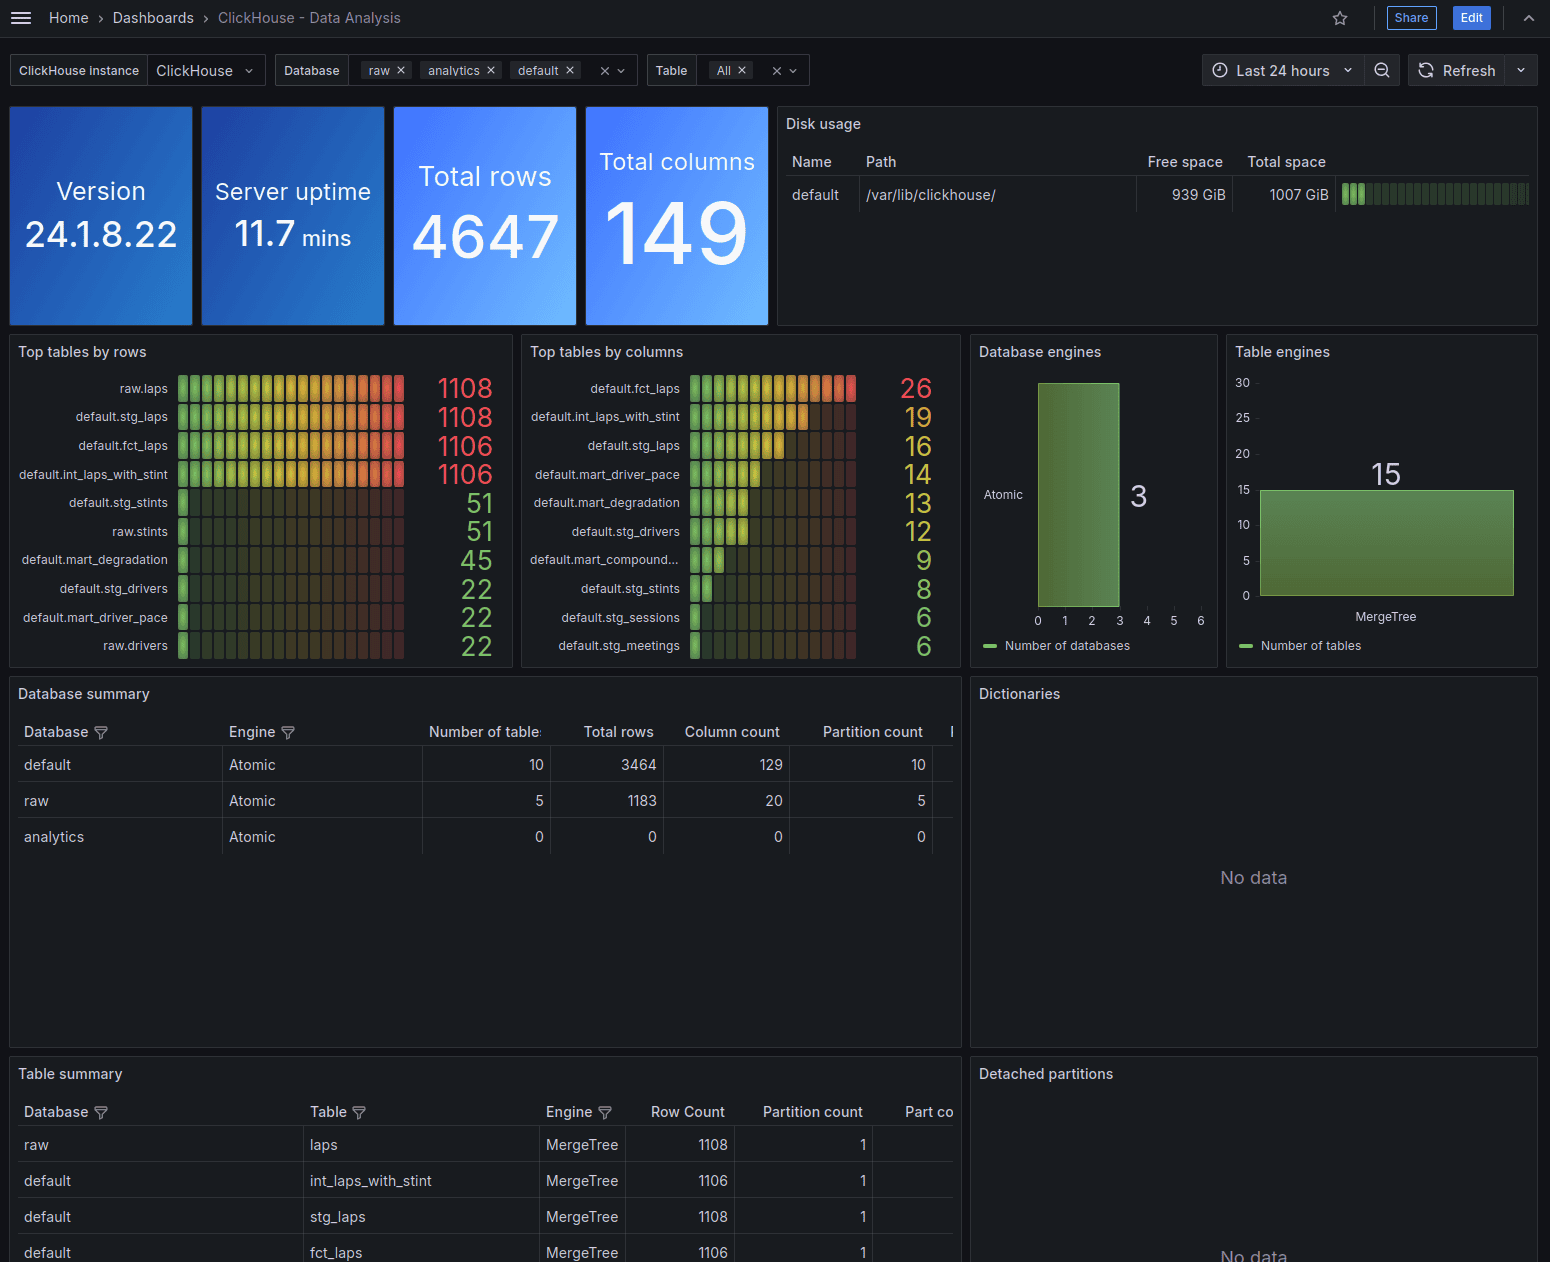
It provides various metrics about the ClickHouse cluster, query performance, resource utilisation, data size, table engine types etc. It can help troubleshoot whether a slowdown in the pipeline is due to the warehouse being slow, queries being inefficient or resource contention in the cluster. My setup has a single node ClickHouse container but in a production setup with a larger cluster, these metrics become even more important to monitor and set up alerts on.
Centralised logging is useful for Airflow task logs and container logs that end up scattered across different sources. With a setup like ElasticSearch in this stack, Cloudwatch on AWS, Loki for Kubernetes setups, you can have a unified place to search and query logs across different services and components.
The main production improvement I would make is alerting. Dashboards are fine for visualising and troubleshooting issues but no team would be continuously monitoring dashboards for things that can go wrong. Alerts based on key metrics like task/DAG failure rate, scheduler health, dbt runtime exceeding SLA etc. can help notify the team when something is wrong and needs attention.
Asset based scheduling
I split the f1 DAG to 3 parts to showcase asset based scheduling as well. The validate task has the database.table asset as the outlet for each of the tables.
1    validate_task = F1ValidateOperator(
2            task_id=f"validate_{endpoint}",
3            conn_id="clickhouse_default",
4            endpoint=endpoint,
5            database=DATABASE_NAME,
6            table=endpoint,
7            batch_size=1_000,
8            max_logged_errors=10,
9            failure_threshold=100,
10            strict=False,
11            outlets=[Asset(f"{DATABASE_NAME}.{endpoint}")],
12        )
13
This creates asset events that trigger any DAGs that are scheduled on these assets.
Once this runs through and the asset events are created, the downstream staging_intermediate_asset DAG kicks off.
1# dags/staging_intermediate_asset.py
2with DAG(
3    dag_id="staging_intermediate_asset",
4    default_args=default_args,
5    schedule=[
6        Asset("raw.meetings"),
7        Asset("raw.sessions"),
8        Asset("raw.drivers"),
9        Asset("raw.laps"),
10        Asset("raw.stints"),
11    ],
12) as dag:
13    ...
14
15# dags/marts_asset.py
16with DAG(
17    dag_id="marts_asset",
18    default_args=default_args,
19    schedule=[
20        AssetAlias("staging_intermediate_asset__int_laps_with_stint__run"),
21    ],
22) as dag:
23    ...
24
The asset events for Cosmos DbtTaskGroup were a bit trickier to get right. I couldn't find the relevant information in the documentation, so I sent Claude to deepdive into the Cosmos package to figure out the asset events generated by it so I can schedule the marts_assets DAG downstream. It figured out correctly (after some deep spelunking), that the pattern was: DAG_name__table__run. If someone knows better ways to handle Assets or AssetAlias-es with Cosmos, please do let me know in the comments.
Conclusion
There are a lot of other features I intend to explore in Airflow 3, dbt and the adjacent stack. It's fun to play around and internalize these new features and setup scenarios where they could be useful in real projects.
I am also planning to continue my Stream Processing with Flink series and add real-time F1 telemetry analysis. Stay tuned for that!
As always, if you have any questions, corrections, feedback or suggestions, please reach out to me! I'd love to hear your thoughts.
Enjoyed this post? Subscribe for more!
We respect your privacy. Unsubscribe at any time.